


Capitale a rischio. Potreste perdere tutto il vostro investimento. Consultate l'avvertenza completa sui rischi qui.

Key Takeaways
The recent breakout above $82,750 needs confirmation to strengthen the long-term bullish outlook.
Interest rates remain a key risk. Persistent inflation and elevated Treasury yields could limit upside in the near-term.
ETF flows could determine how fast Bitcoin recovery continues.
Bitcoin Price Outlook: $75,000-$95,000 Range Before a 2027 Recovery
Bitcoin trades around $83,000, about a third below its October 2025 record of $126,223, and its next move depends less on crypto than on the bond market. Our base case is a $75,000–$95,000 range into year-end: upside needs a turn in Fed policy, while downside needs another shock to risk appetite. Looking ahead into 2027, we see Bitcoin reclaiming its previous record high.
Bitcoin is Driven by Treasury Yields, Oil Prices and Fed Policy
The biggest force on Bitcoin right now is not halving math or ETF headlines. It is the price of money. The 10-year Treasury touched 5.36% on the 7th of October and the 30-year hit 5.73%. Minutes from the Fed's September meeting show a unanimous vote to raise rates, and most officials see another hike as likely by year-end.1
For a non-yielding asset, that is the toughest backdrop there is. When a risk-free Treasury pays 5%, Bitcoin competes with a coupon, not just with gold. Brent above $100 adds a second layer: it keeps inflation sticky, the Fed hawkish and the dollar bid.1 Reports that Washington is preparing for renewed strikes on Iran complete the picture of a market trading Bitcoin as high-beta risk, not as a hedge.
The flip side matters just as much. Bitcoin is the asset most geared to a policy pivot. If oil eases and the Fed signals the hiking cycle is done, liquidity-sensitive assets will move first, and Bitcoin sits at the front of that queue.
Crypto Regulation: CLARITY Act Delays Weigh on Institutional Adoption
Washington was expected to provide a tailwind for Bitcoin in 2026. Instead, progress on crypto regulation has stalled. On 15 September, the Senate failed to invoke cloture on the CLARITY Act, legislation designed to divide crypto oversight between the SEC and the CFTC, after opponents secured 41 votes. Bitcoin fell below $76,000 following the setback.2
The bill remains on the Senate calendar, leaving the door open for another attempt.2 However, with the midterm elections scheduled for 3 November, the window for meaningful legislative progress in 2026 has narrowed considerably. For institutional investors, regulatory clarity is a prerequisite for broader adoption, not merely an added benefit. The delay does not undermine the long-term investment case for Bitcoin, but it could postpone the next wave of institutional and corporate balance-sheet adoption.
ETF Flows: Fast Money Sets the Ceiling, Patient Money Builds the Floor
Wall Street plumbing is now the heartbeat of Bitcoin. US spot Bitcoin ETFs saw $487.07 million of outflows on the 7th of October, the largest single-day withdrawal since the 25th of June.3 The same day, US government-linked wallets moved about $566 million in assets, mostly to Coinbase Prime, and a whale dormant for over four years moved 4,500 BTC.3
Two forces are pulling in opposite directions. In the short run, ETF money is tactical. ETF holders sitting on losses are more likely to cut exposure than buy the dip. In the long run, the structural bid has not left. Long-term holders kept adding through the drawdown, taking their holdings to a record by July,3 and Strategy has kept buying, to more than 845,000 BTC.
Until ETF flows turn persistently positive, rallies are likely to be sold. But the deeper the dip, the more patient capital is waiting underneath it.
Bitcoin Technical Analysis
From a technical perspective, the chart of Bitcoin is showing two strong bullish signals, suggesting that Bitcoin may have bottomed in July 2026. The first is the daily Relative Strength Index (RSI) indicator, which moved into a bull market range in August. The second is the weekly RSI breaking above its downtrend line from the March 2024 high. This downtrend developed as a significant bearish divergence formed on the weekly chart, leading up to the cycle peak of Bitcoin in October 2025.
The RSI is a leading momentum indicator that can signal potential trend reversals before they become apparent in price action. However, despite these encouraging signals, price confirmation is still needed before concluding that a new bull market has begun.
From a price perspective, a decisive and sustained break above key resistance at $82,750 would be required to confirm that the downtrend from the October 2025 high has ended and a new primary uptrend has begun.
In the short term, Bitcoin is at a critical decision point. The rebound from the summer lows remains intact, but repeated failures near $87,000, alongside the formation of a small bearish divergence, suggest that sellers remain active at this level. While the broader recovery appears to have room to extend over the coming months, the risk of another near-term pullback remains.
In our view, a sustained breakout above key resistance is a matter of when, not if. Once confirmed, it could pave the way for Bitcoin to reclaim its old and reach new all-time highs over the longer term.
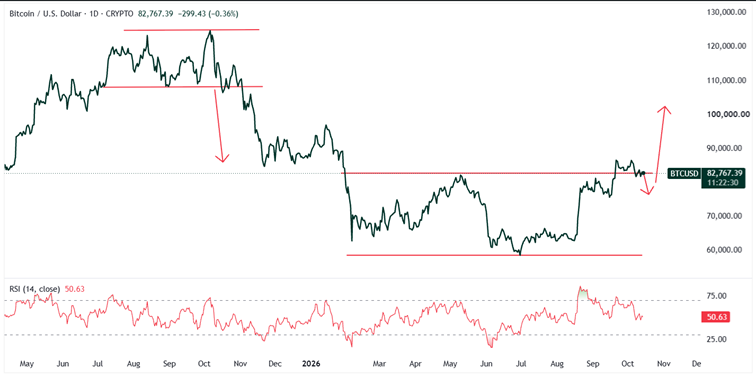
Source: TradingView. Bitcoin daily price chart as of October 14, 2026.
Low Volatility Could Be the Calm Before a Bigger Move
Another factor worth watching is the declining volatility of Bitcoin. After a period of substantial price swings, the market has entered a quieter phase in October. Periods of consolidation have often been followed by a pickup in volatility, although they cannot predict the direction of the next move.
When prices trade in a narrow range it can create a misleading sense of stability. Once a major catalyst arrives, positioning can change quickly, particularly when traders are using leverage.
For Bitcoin, that catalyst could be an inflation surprise, a change in Federal Reserve expectations, a renewed wave of ETF inflows or a broader change in equity-market sentiment. The U.S. midterm elections on the 3rd of November could also add to uncertainty around the policy outlook and the future direction of cryptocurrency regulation.
Conclusion:
Our near-term view is cautiously optimistic, with the balance of risks depending on whether Bitcoin can hold support and regain momentum. The cryptocurrency has demonstrated resilience despite higher yields and a stronger dollar, but resilience alone is not enough to establish a renewed uptrend.
The bullish scenario rests on three conditions: Bitcoin holds the $80,000 area, ETF demand improves and the price breaks decisively above $87,000. If those conditions align, a move towards $95,000 becomes a plausible first target.
The bearish scenario is equally clear. Persistent inflation, elevated Treasury yields and continued ETF outflows could undermine risk appetite. A sustained break below $80,380 would weaken the recovery and put the $75,000 area back in focus in the short-term. However, such a pullback would not necessarily invalidate the potential bottom formation or the prospect of a subsequent trend reversal.
Ultimately, Bitcoin does not need a perfect macroeconomic backdrop to recover. It does, however, need buyers willing to absorb selling pressure and sustain a move beyond resistance. Until that happens, the recovery remains a work in progress rather than a confirmed return to an established uptrend.
Professional investors looking for magnified exposure to Bitcoin may consider Leverage Shares +3x Long Bitcoin or -3x Short Bitcoin ETPs.
Footnotes
1. NBC News, Global bond sell-off pushes U.S. Treasury yields to fresh 24-year highs, as of October 7, 2026.
2. Bitcoin.com News, CLARITY Act Made 126 Concessions and Still Couldn’t Get 60 Votes, as of September 15, 2026.
3. 21Shares, Bitcoin 2026: history signals an attractive entry window, as of July 8, 2026.
Capitale a rischio. Potreste perdere tutto il vostro investimento. Consultate l'avvertenza completa sui rischi qui.
 Market Insights
 Education

