



Your capital is at risk if you invest. You could lose all your investment. Please see the full risk warning here.

On the 28th of August, Federal Reserve Chair Kevin Warsh delivered his first Jackson Hole keynote. In the symposium organised under the theme "Financial Innovation: Implications for Payments and Policy", Warsh didn’t address the buybacks announced by Treasury Secretary Scott Bessent; he addressed inflation. Warsh said the Fed would “have work to do” if policymakers were not confident that underlying inflation was returning to the 2% objective, and noted that although summer inflation readings had come in better than expected, they did not tell him that underlying trends had meaningfully improved. Despite not offering forward guidance, the market read this as a strong signal for a rate hike in the offing.
This didn’t last and the market followed a pattern it had already telegraphed nine days earlier.
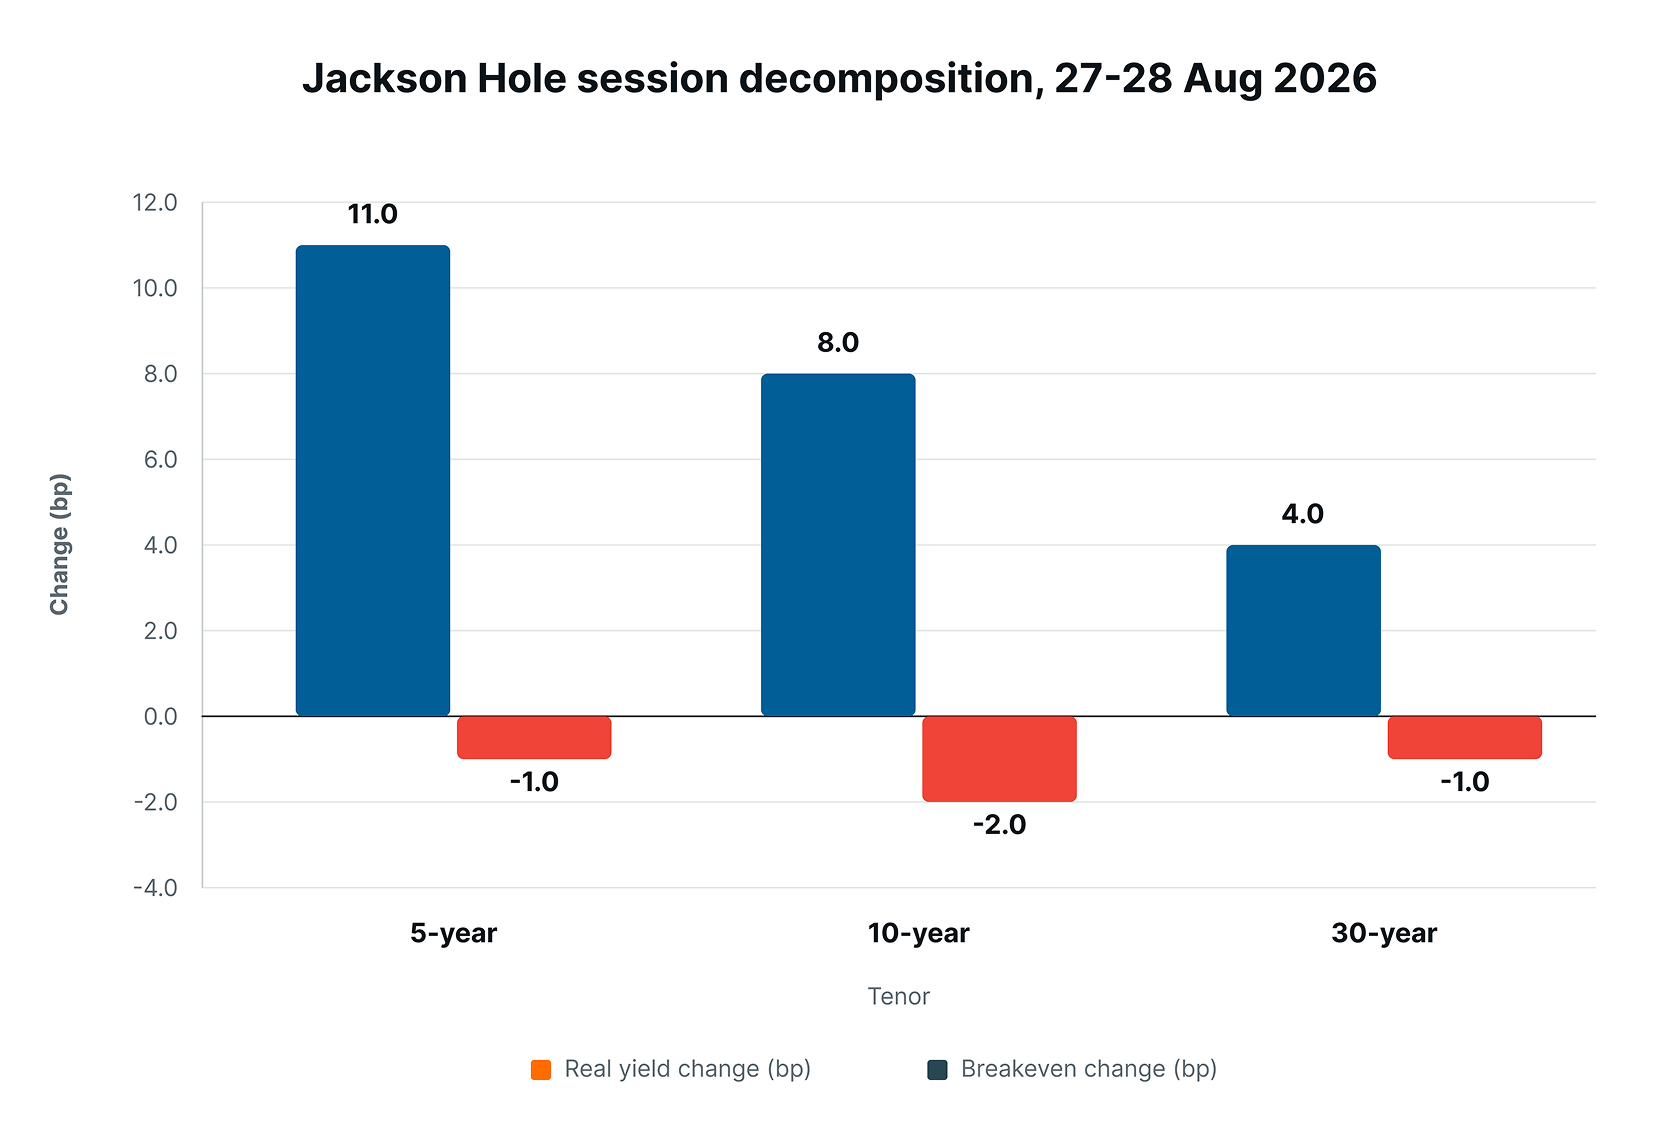
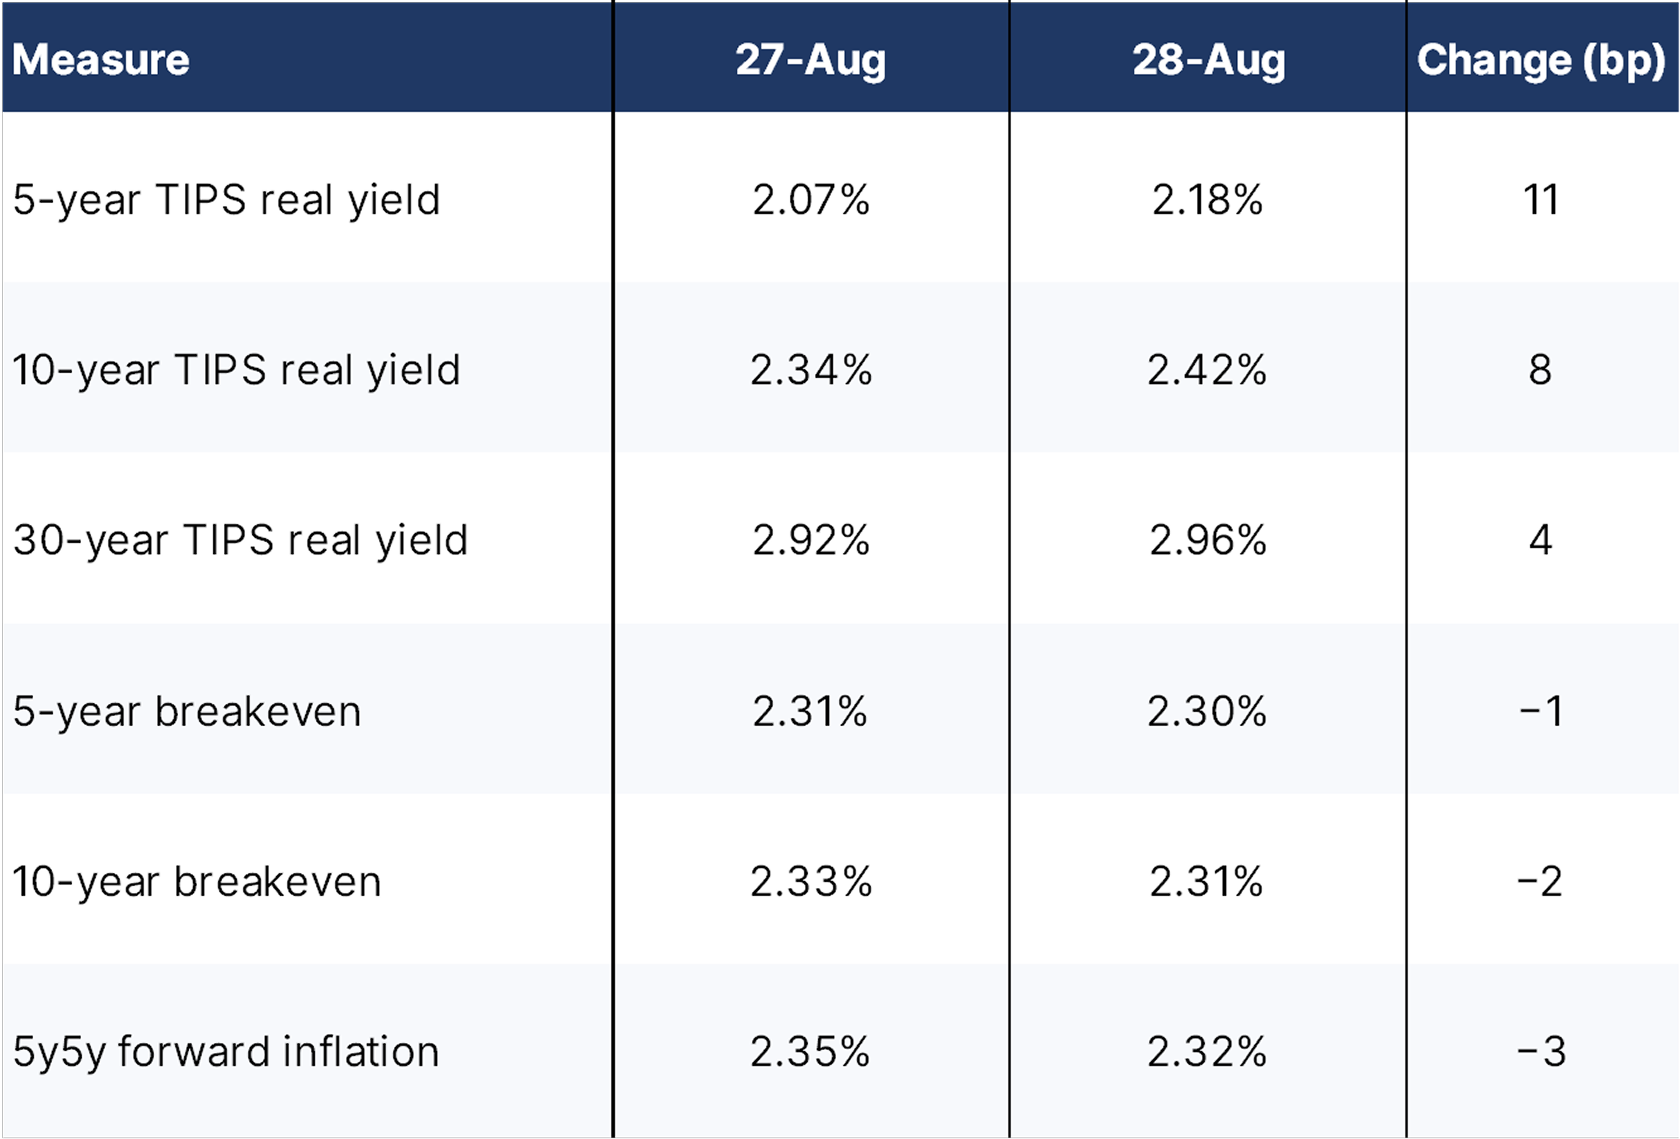
Bear Signals and Market PatternsNow, nominal yields alone cannot distinguish a credible hawkish signal from a loss of confidence as both would trigger a rise in yields. The Treasury Inflation-Protected Securities (TIPS) segment within US government bond market – wherein the bond's value goes up when inflation as marked by the Consumer Price Index (CPI) rises and goes down when prices drop – provided some interesting signals on the 28th.
Source: Leverage Shares analysis
Source: Leverage Shares analysis
The market marked up the expected path of real policy rates and marked down long-run inflation. Warsh’s impact was felt – for all of two sessions.
By the 1st of September, the “breakeven”, i.e. the difference in yield between nominal U.S. Treasury bonds and inflation-protected securities (TIPS) of the same maturity – for the 5-year segment had risen 6bp above its pre-speech level to 2.37% The 10-year breakeven also rose above pre-speech levels to 2.35%. The U.S. 5-Year, 5-Year Forward Inflation Expectation Rate (5y5y) – which is market-based measure of expected average inflation over the five-year period that begins five years from a date – rose to 2.33%.
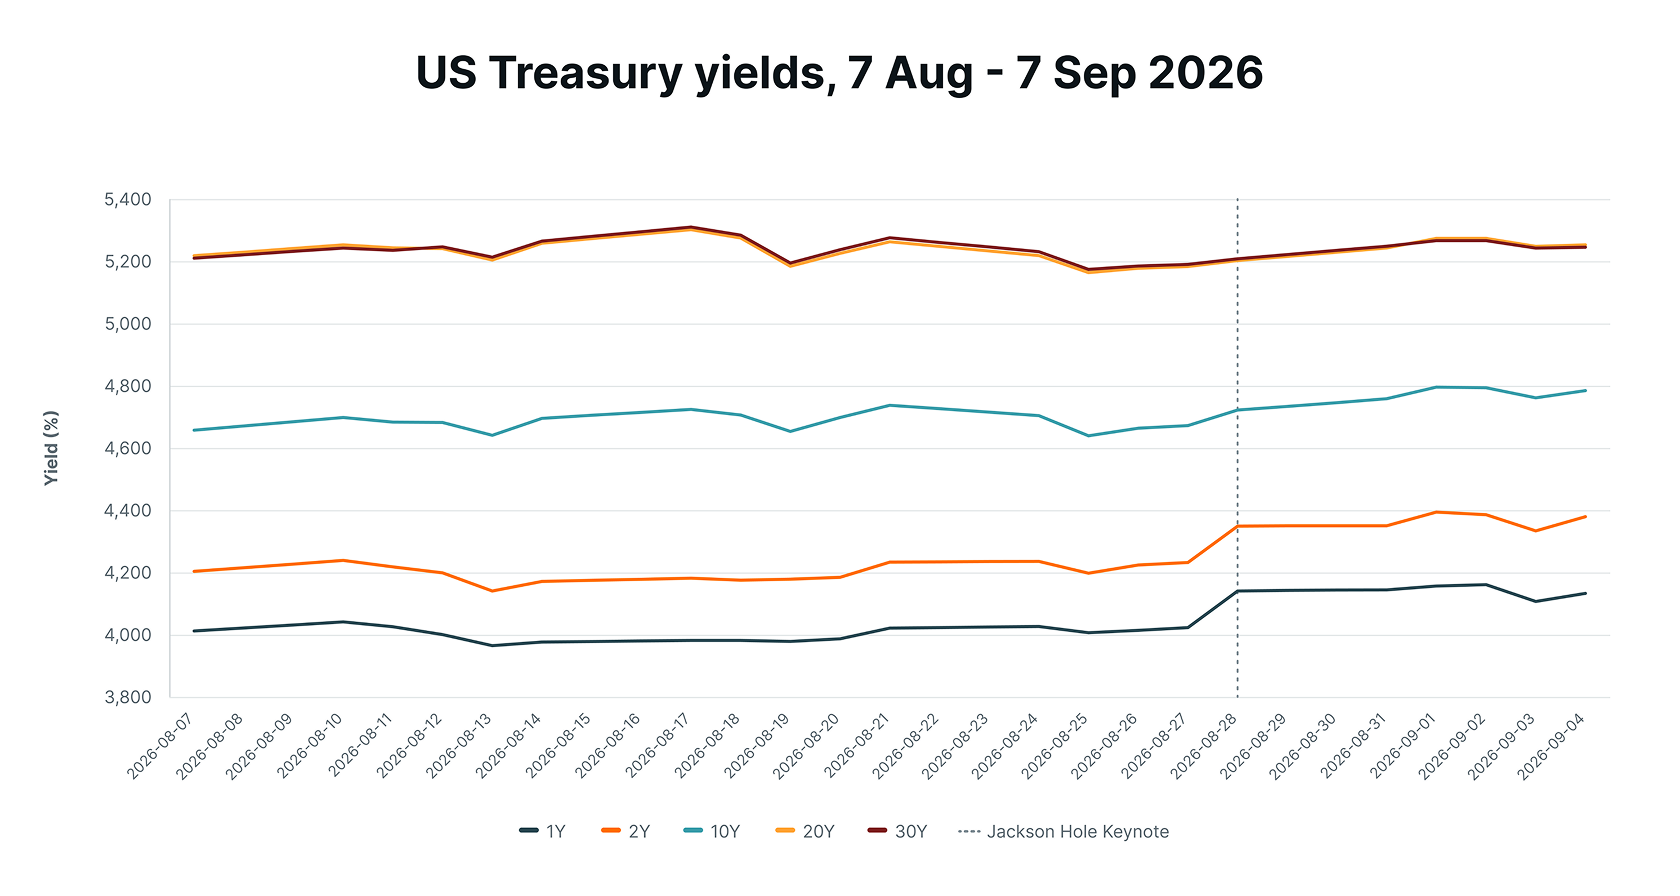
Between the 7th of August and the 4th of September 2026, the US Treasury curve underwent a pronounced bear flattening. Almost all of it occurred in a single session: the 28th of August. Within the “Constant Maturity” series published by the US Department of the Treasury – representing theoretical yields for fixed maturities interpolated from actively traded U.S. Treasury securities – yields rose across the board. The curve essentially flattened because the “front end”, i.e. the 1- and 2-year securities, rose rapidly.
Source: Leverage Shares analysis
On the 28th of August, the 1-year rose 12bp (basis points) and the 2-year rose 11.8bp while the 20-year rose 2.1bp and the 30-year 1.7bp.
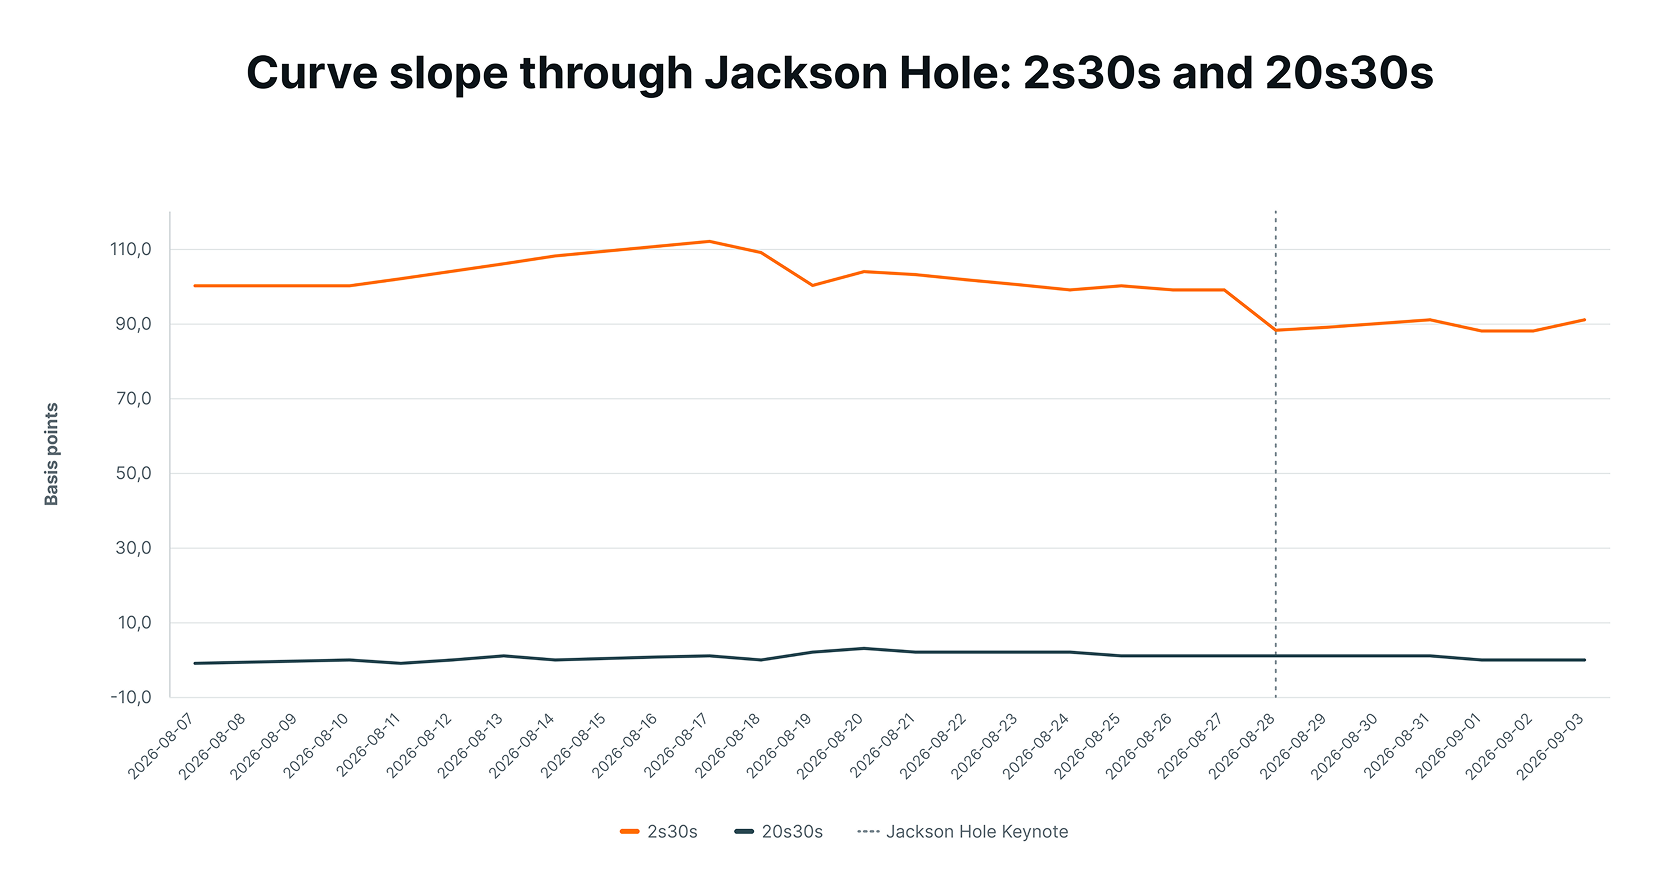
In the same timeframe, the spread between the 20-year and the 30-year finished 0.4bp lower. Simply put, an investor extending from twenty years of duration to thirty is now being compensated with nothing. Perhaps more striking is the long-form decline of the 2s30s spread, which measures the difference between the yield on the 30-year Treasury bond vs the 2-year.
Source: Leverage Shares analysis
The 2s30s witnessed a steepening decline after hitting a peak being reached on the 17th of August, with the first leg starting on the 19th of August when Secretary Bessent announced that the US government would at least double liquidity-support buyback operations from $2 billion to at least $4 billion per operation, targeting the 10-to-20-year and 20-to-30-year sectors, effective the 9th of September. This reversed a steepening led by rising 30-year yields that had run through the first half of the month and initiated a “bear-flattening” pattern instead, a sign of economic pressure resulting in a surge in short-term yields while long-term yields remain more-or-less anchored.
Now, the effects of Bessent’s signalling on price guarantees on long-term bonds were felt: the 30-year did fall 9bp to 5.194%. Over the next two sessions, however, the yield did rise to close the 21st of August at 5.276%. In effect, the aftermath of Warsh’s announcement was telegraphed in the market’s reaction to Bessent’s: a two-day holiday followed by a net pricing upwards.
It is widely expected that the buyback would be guaranteed by increased issuances into the 1- and 2-year segments. Given the size and liquidity of these segments, textbook expectation is the supply would be absorbed and the segments would be gradually repriced. The front end denoting the 1Y/2Y segments, however, rose relatively rapidly on rate hike expectations.
It can be considered as given that the buyback guarantee was made by the world’s largest issuer of government bonds in order to accommodate the world’s largest foreign buyer of US debt: Japan. However, a distinctively different set of dynamics are afoot in Tokyo.
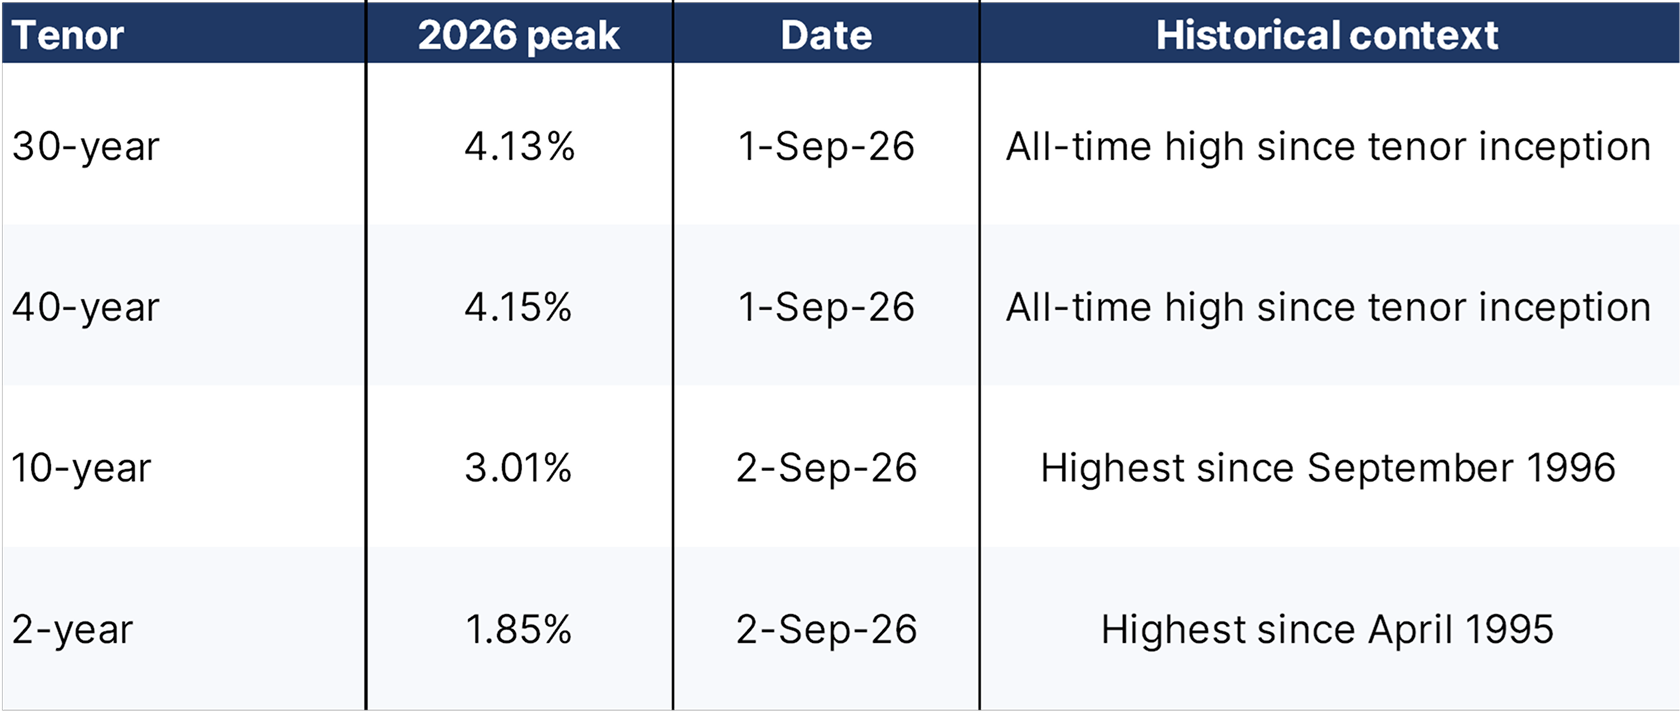
The Tokyo DriftJapan’s Ministry of Finance offers data series through 1974 and September data indicates that numerous records in yields have already been set across maturities.
Source: Leverage Shares analysis
Prime Minister Sanae Takaichi has long held an expansionary fiscal agenda as an extension of “Abenomics”, resulting in the need for vast quantities of funding. To defend the yen, a debt selloff – mostly in short-term US debt – was aggressively pursued between 30 July and 26 August.
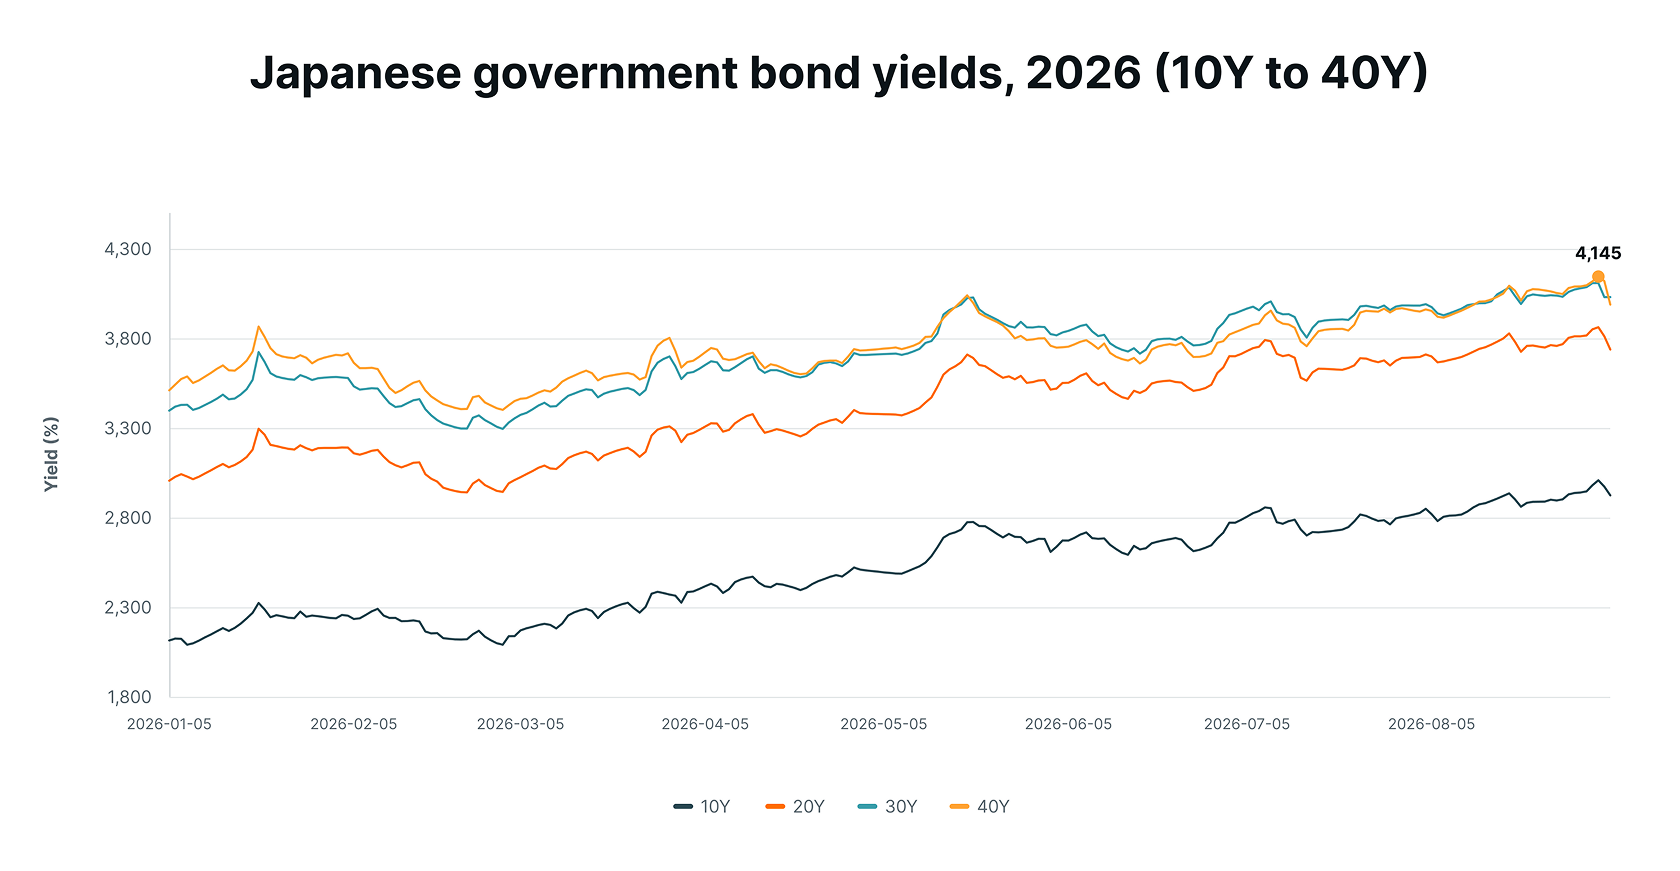
Japanese Government Bond (JGB) yields had risen through most of 2026 alongside US Treasuries, though for different reasons and on a different schedule — the Bank of Japan’s exit from near-zero rates and its tapering of purchases, combined with the expansionary fiscal agenda. The BoJ still holds roughly half of outstanding JGBs, and its withdrawal as the marginal buyer left domestic institutions to absorb supply they had spent two decades of near-zero yields avoiding in favour of foreign bonds. Early September offered the first tentative sign that they are returning:
Source: Leverage Shares analysis
After the JGB 30-year and 40-year set all-time highs on the 1st of September at 4.131% and 4.145% respectively, the “super-long” segment dropped 16 to 18 basis points in two sessions after a well-covered 30-year JGB auction on the 3rd of September. The longer the tenor, the larger the rally – a pattern consistent with liability-driven buying. However, the front end – 2-Year JGBs – rose in yield on the back of selloffs pivoting on BoJ hike expectations.
The flavour being established now is that the BOJ’s rate hike is creating simplified channels of access to Japanese liability owners, who spent the past two decades reaching for foreign DM bonds and paying for the currency hedge because domestic yields offered nothing. With domestic yields rising, that trade reverses: a hedged 10-year JGB now yields roughly 100bp more than a hedged 10-year Treasury, with no currency mismatch against yen liabilities. Throughout Q1 2026, Japanese investors sold an estimated $29.6 billion of US debt. This is private-sector repatriation, which is adding to JGB demand while removing Treasury demand.
Of course, like in the US, the slip is in tens of basis points and doesn’t really resolve the high cost of financing that is being rolled off into the decades to come – and potentially creating yet another crisis similar to the bond crisis Bessent and Warsh’s actions have failed to staunch sustainably in the US. For now, in the US at least, the 20s30s spread sitting at zero is a supply-and-liquidity signal implying that the marginal buyer of ultra-long duration has withdrawn, and that the segment is clearing on price rather than on demand. If the world’s largest foreign buyer of US debt continues turning inwards, the steady selloff of long-term debt amidst an operation absorbing supply that Japanese investors are releasing would make its presence felt in the 2s30s as well. While the carry the 2-year bond has against the 30-year has been narrowing all year, T-Bills are currently clearing at fair value and the front end’s market is absorbing supply. However, the capacity to continue absorbing without getting cheaper is finite. The $2.5 trillion cash cushion – a by-product of pandemic-era money printing meeting a shortage of government bills – that funded three years of short-term issuance is now empty. Bank reserves at the Fed are down to $2.9 trillion and falling by $120 billion a quarter. While Japanese selling would steepen the 2s30s, the bills funding the response via the money-market segment would flatten it. Which force prevails is the actual question.
Professional investors in Europe have numerous options to consider with regard to the US government bond market. The +5x Long 7-10 Year Treasury Bond ETP (IEF5) and the -5x Short 7-10 Year Treasury Bond ETP (IE5S) provide exposure to the mid-range maturity bond market during bullish and bearish turns respectively, the +5x Long 20+ Year Treasury Bond ETP (TLT5) and the -5x Short 20+ Year Treasury Bond ETP (TL5S) do the same for longer-duration bond market, and the +5x Long TIPS Inflation Protected US Bond ETP (TIB5) and the -5x Short TIPS Inflation Protected US Bond ETP (TI5S) provide exposure to the TIPS market.
Your capital is at risk if you invest. You could lose all your investment. Please see the full risk warning here.
 Market Insights
 Education

